Amplifying Employee Productivity

with Tabular Reporting and Analytics.

What is Tabular Reporting and Analytics?

"Analytics Tabular Reports" in the context of Employee Monitoring Software refer to structured data representations that provide detailed insights and information about employee activities, productivity in percentages, and behaviour within an organization. Typically, these reports feature numerical data organized in rows and columns, resembling a table, simplifying the process for businesses to analyse and base data-driven decisions regarding their workforce. Here's a more intricate explanation:

Key Features of Tabular Reporting and Analytics
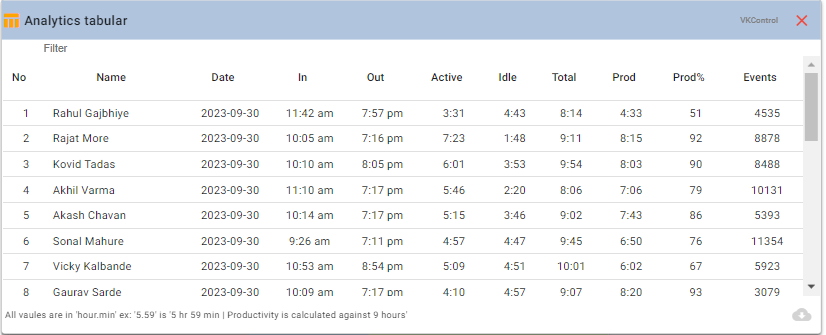
Structured Data

Structured Data

Tabular reports present data in an organized and structured format, allowing businesses to view employee-related information in a systematic manner. This data can include details such as Name, Date In times, Out Time, Active, Idle , Total Time, Productivity, Productivity in percentages, Event counts, and more.

	Data Visualization Enhancement

Data Visualization Enhancement

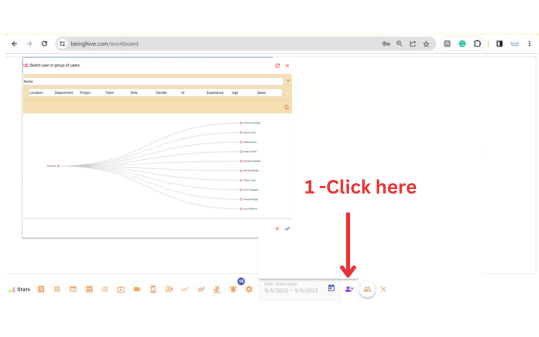
To offer a more comprehensive and visual representation of employee data, tabular reports can be enriched through the incorporation of data visualization tools, including charts and graphs. This facilitates the quick identification of patterns and trends at a mere glance.

Real-Time Tracking

Real-Time Tracking

Stats employee monitoring tools provide real-time updates in these tabular reports, allowing employers to monitor activities as they happen. This can be especially useful for identifying and addressing issues promptly.

	Historical Data

Historical Data

Tabular reports can also store historical data, enabling businesses to analyse trends and patterns over time. This is essential for making informed decisions and improving workforce productivity.
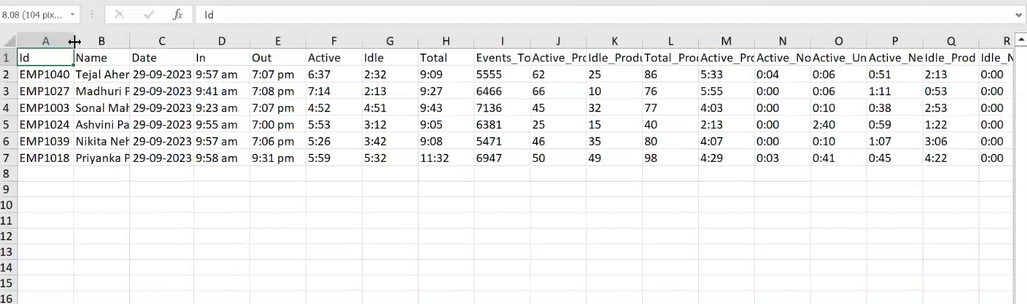
	Customization

Customization

Users of employee monitoring software can often customize the data fields after Download the report and metrics they want to track. This allows organizations to focus on the specific information that is most relevant to their needs.

Productivity Tracking

Productivity Tracking

These reports play a crucial role in measuring and improving employee productivity. They can provide insights into how employees spend their time, which tasks take longer to complete, and where improvements can be made.

Compliance and Security

Compliance and Security

Employee monitoring software ensures that the data within these reports is secure and complies with privacy regulations. Access to this data is typically restricted to authorized personnel only.

Drill-Down Capabilities

Data Analytics

The data within tabular reports can be subjected to data analytics, allowing organizations to gain deeper insights and perform trend analysis. This can aid in forecasting and strategic decision-making.

In summary, Analytics Tabular Reports within Employee Monitoring Software are an integral part of the tools used by organizations to track, analyse, and optimize employee performance and activities. They provide a structured and customizable way of presenting data, allowing employers to monitor, assess, and improve the productivity and efficiency of their workforce while ensuring compliance with data security and privacy standards.

How to Generate Stats Employee Tubular Report?

Generating an employee Tubular Reporting and Analytic in employee monitoring software involves specific steps to gather, analyse, and present real-time data about your employees' activities. Here's a general guide on how to generate such a report:

Step 1: Access the Employee Monitoring Software

Log in to your employee monitoring software using your credentials. Ensure that you have the necessary administrative privileges to generate dynamic reports.

 Employee Selection

Step 2: Employee Selection

Select the whole organization employee or branch or team or specific employee as your choice for whom you want to generate dynamic report to check inside of work. And select date range.

Step 3:Select the Tubular Report Module

Select the Tubular Report Module

Click to the Tubular Report module which is bottom of the software. Dynamic Report option available at 4th position at the bottom of the software.

Step 4:Tubular Report Preview

Tubular Report Preview

A new window will appear on screen which show the preview of Tubular Report on screen. Click on Download option and download full report. The software will gather real-time data based on your specified Date and generate a Tubular Report in excel sheet format.

Step 5 : Analyse the Report

Analyse the Report

After the report is generated, it will be displayed in an Excel sheet format. You can promptly access historical data, analyse trends, and make data-informed decisions based on the past presented information. Use visualizations and drill-down capabilities to gain deeper insights.

Keep in mind that the above steps must follow in the Stats employee monitoring software you use. Contact to take assistance from V K Control System’s support team for guidance to use your Stats software.

"Try Our Employee Monitoring Software for Enhanced Tubular Reporting and Analytics!"

Insightful Data field of Tubular Reporting and Analytics

1. Id: Present the employee’s ID.

3. Date: Present the Date

5. Out Present the employee’s Logout Time in a System.

7. Idle Present the employee’s Idle Time spent in working hours in%.

9. Event Total :Present the Total Event Count.

11. Idle Productivity: Idle time spent over productive App.

13. Active_Prod: Active time spent over Productive App or websites.

15. Active _Uncat: Active time spent over Uncategorised App or websites.

17. Idle_Prod: Idle time spent over Productive App or websites.

19. Idle_Uncat:Idle time spent over Uncategorised App or websites.

21. Total_Produc:Total time spent over Productive App or websites.

21. Total_Produc:Total time spent over Productive App or websites.

21. Total_Produc:Total time spent over Productive App or websites.

23. Total_Uncat:Total time spent over Uncategorised App or websites.

25. Event_Prod: Number of Event Happen on Productive App ad Website

27. Event_Uncat:Number of Event Happen on Uncategorised App ad Website

29. Location :Location Name

31. Project:Project Name

2.Name: Present the employee’s name.

4. In Present the employee’s Login Time in a System .

6. Active Present the employee’s Active Time spent in working hours in %.

8.Total:Present the employee’s Total Time spent in working hours in %.

10. Active Productivity: Active time spent over productive App.

12.Total productivity:Sum of Active Productivity and Idle Productivity.

14. Active_Non_Prod: Active time spent over Non-Productive App or websites.

16. Active_Neutral: Active time spent over Neutral App or websites.

18. Idle_Non_ProdIdle time spent over Non-Productive App or websites.

20. Idle_Neutral:Idle time spent over neutral App or websites.

22. Total_Non_Produc:Total time spent over Non-Productive App or websites.

24. Total_Neutral:Total time spent over neutral App or websites.

26. Event_Non_Prod:Number of Event Happen on Non Productive App ad Website

28. Event_Neutral:Number of Event Happen on Neutral App ad Website

30. Department:Department Name

32. Team :Team Name

33. Role Role of Employee.

Benefits of Tabular Reporting and Analytics

Tabular Reporting and Analytics within employee monitoring software offers numerous advantages that are essential for modern businesses aiming to enhance transparency, boost productivity, and make data-driven decisions. Here, we'll look into the key benefits:

1. Increased Transparency in Employee Activities :

Tabular reports provide a comprehensive overview of employee activities, offering a clear and detailed account of what employees are doing during work hours.
Employers can access real-time data on login/logout times, tasks completed, applications used, and websites visited. This transparency fosters accountability among employees.

2. Enhanced Productivity and Performance Tracking:

Tabular reports enable precise monitoring of employee performance by tracking key metrics and KPIs (Key Performance Indicators).
Employers can identify bottlenecks, time-wasting activities, or underperforming employees. This data-driven insight allows for targeted interventions to improve productivity.


3. Data-Driven Insights for Better Decision-Making:

Tabular reports serve as valuable sources of data that can be analysed to generate insights and drive informed decision-making.
By examining historical data and trends, businesses can make strategic decisions to optimize workflow, resource allocation, and employee training.
Reports can identify top-performing employees, recognize areas where additional training is needed, and help businesses allocate resources more effectively.


4. Customization and Focus:

Tabular reports are highly customizable, allowing organizations to tailor the data they want to track. This feature ensures that the data being analyzed is directly relevant to the specific needs and goals of the business.
Businesses can choose to monitor certain applications, activities, or departments, enabling a laser-focused approach to analysis.


5. Real-Time Monitoring and Alerts:

Stats tabular reporting and Analytics provide real-time data updates, allowing employers to monitor employee activities as they happen.
Real-time alerts can be configured to notify management of specific activities or events, enabling quick responses to potential issues.

6. Compliance and Security Assurance:

Employee monitoring software ensures that data within tabular reports is protected and complies with data privacy regulations.
By maintaining the privacy of sensitive information, businesses can maintain trust with their employees and adhere to legal requirements.

7. Cost Savings and Efficiency Gains:

Tabular reporting and analytics help identify areas where resources may be misallocated or underutilized.
By optimizing resource allocation based on insights from reports, businesses can reduce unnecessary costs and improve overall efficiency.

In conclusion, Tabular Reporting and Analytics in employee monitoring software empowers organizations with valuable data that enhances transparency, productivity, and decision-making.
With these reports, businesses gain a deeper understanding of employee activities, which can lead to more efficient workflows, optimized resource allocation, and ultimately, improved performance and profitability.

Enhancing Insights with Tabular Reports

Data visualization is a powerful complement to tabular reports in employee monitoring software, offering a more comprehensive view of employee activities. This combination of tabular reports and visualization tools transforms raw data into easily digestible insights, providing a more intuitive and actionable perspective on workforce performance. Here's how data visualization enhances the value of tabular reports:

1. Clarity and Accessibility: :

While tabular reports present data in a structured format, they may not immediately reveal underlying trends or patterns
Data visualization tools, such as table ,charts, graphs, and dashboards, offer a visual representation of the same data, making it easier for stakeholders to grasp complex information at a glance.
Employers can access real-time data on login/logout times, tasks completed, applications used, and websites visited. This transparency fosters accountability among employees.

2. Identifying Trends and Anomalies:

Visual representations help in identifying trends, anomalies, and correlations within employee data that might be less evident in tabular reports alone.
For instance, line charts can display trends in employee productivity over time, while bar charts can highlight variations in the use of specific applications or websites.


3. Real-Time Monitoring:

Data visualization tools can offer real-time updates, providing an immediate visual overview of what employees are doing.
Managers can quickly spot unusual patterns or behaviours, enabling them to address issues or provide timely feedback.


4. Data Aggregation:

Visualizations can aggregate data from tabular reports, simplifying complex datasets into easy-to-understand summaries.
For instance, a pie chart can provide a breakdown of time spent on different activities, offering a clear picture of how employees allocate their working hours.


5. Interactive Decision-Making:

So Interactive visualizations allow users to drill down into specific data points, enabling a deeper exploration of employee activities and their impact on business outcomes.
Decision-makers can click on elements in a chart to access more detailed information, fostering a more informed decision-making process.

In conclusion, data visualization serves as a crucial element within employee monitoring software, elevating the utility of tabular reports by rendering intricate data more user-friendly, actionable, and illuminating. The harmonious integration of these two components empowers businesses to attain a deeper comprehension of their workforce's activities, productivity, and performance, fostering well-informed decision-making and heightened operational efficiency.

Common Quenstion on Tubular Reporting and Analytics

Q 1. What are tabular reports in employee monitoring software?

Tabular reports are structured representations of employee data, presented in a table format. They provide a detailed overview of employee activities, tracking metrics such as login/logout times, Productive Time , Productive Time, and Event Count among other data points.

Q 3. Can tabular reports be customized to suit specific business needs?

Yes, Stats employee monitoring software allows option for the customization of tabular reports you have download report and take data as your requirement. Additionally Stats Employee Monitoring Software provide dynamic report option on workboard where Users can choose the data fields and metrics they want to track, enabling businesses to focus on the specific information that is most relevant to their goals and objectives.

Q 5. How can tabular reports help in improving employee productivity?

Tabular reports enable businesses to track key productivity metrics and KPIs, identify bottlenecks, and recognize areas where additional training or support may be needed. By providing data-driven insights, these reports are instrumental in optimizing employee performance.

Q 7. How do Tubular Report complement tabular reports?

Data Tubular Report enhance tabular reports by presenting the same data in a visual format, making it easier to identify trends, anomalies, and correlations within employee data. Stas Software help stakeholders grasp complex information at a glance, fostering more informed decision-making.

Q 9. How can I get the most out of tabular reports and data visualization in employee monitoring software?

To maximize the benefits of tabular reports and data visualization, it's essential to set clear objectives, customize reports to match your business needs, and regularly analyze the data to identify areas for improvement. Additionally, ensure compliance with data privacy regulations and maintain transparency with employees regarding monitoring practices.

Q 2. How do tabular reports benefit businesses?

Tabular reports offer several advantages, including increased transparency in employee activities, enhanced productivity and performance tracking, and data-driven insights for better decision-making. They provide a clear picture of what employees are doing during work hours and help organizations make informed decisions to optimize workforce performance.

Q 4. Are tabular reports suitable for real-time monitoring?

Yes, Stats employee monitoring software solutions offer real-time updates in tabular reports. This feature allows employers to monitor employee activities as they happen, making it possible to identify and address issues promptly.

Q 6. Are tabular reports compliant with data privacy regulations?

Yes, employee monitoring software is designed to maintain data privacy and security. Access to tabular reports is typically restricted to authorized personnel only, ensuring compliance with data privacy regulations and maintaining employee trust.

Q 8. Can Stats Tubular Report provide real-time monitoring as well?

Yes, some data visualization tools offer real-time updates, allowing employers to gain an immediate visual overview of employee activities. This real-time monitoring can help identify unusual patterns or behaviours for quick response.

Q 10. Is Stats employee monitoring software suitable for all types of businesses and industries?

Stats Employee monitoring software can be adapted to suit the needs of various businesses and industries. It's particularly valuable for organizations looking to improve productivity, maintain compliance, and gain data-driven insights into employee activities, making it a versatile tool for many sectors. However, the specific features and configurations may vary based on the industry's requirements.

  • Email marketing@vkcontrol.com
  • Employee Monitoring Software +91-8956090452/51/57/58
  • Billing Software +91-9168696090/91/92/93
  • Addresses Pune
    V K Control System Private Limited
    Office No. 208, 2nd Floor
    Suratwala Mark Plazo,
    Hinjewadi Phase 1 Rd, Hinjawadi,
    Pune, Maharashtra, India-411057
    ____________________________________
    Amravati
    V K Control System Private Limited
    Nirmal-Vijay, Ground Floor,
    Panchashil Square,
    Tapovan Road, Camp,
    Amravati, Maharashtra, India-444602 ____________________________________
    Romania
    Sleek Bill International SRL
    Bucharest, Romania